Sometimes xdebug can be tricky to install and configure, especially in scenarios where it wasn’t designed to work natively, such as running your project in WSL or Docker.
Today I will show you two simpler alternatives for debugging PHP, which will help you debug your project without wasting time on long installations.
Pre-installation
What we will use in this tutorial:
- PHP 8.4
- Composer 2.8
Note: Since all versions of PHP 7 and Composer 1 are no longer supported, avoid using them.
You can find a tutorial on how to update your PHP 7 to PHP 8 here, and a tutorial on how to install composer the right way here.
To update your composer, you can simply run:
./composer self-updateKint – Advanced PHP dumper
🐈⬛ https://github.com/kint-php/kint
The first debug tool is the Kint. Think of Kint as a smart evolution of a var_dump(), but much more complete and interactive.
Instalation
./composer require kint-php/kint --devUsage with Composer
<?php

include 'vendor/autoload.php';

d('Dumped with Kint');

$time = new DateTime();
$data = [
    'id' => 42,
    'status' => 'active',
    'features' => ['debug', 'logging', 'profiling'],
    'settings' => [
        'theme' => 'dark',
        'notifications' => true
    ]
];
$object = new stdClass();
$object->title = "My Symfony Clone";
$object->author = "Fellipe";
$object->version = 1.0;

d($time, $data, $object);Resources
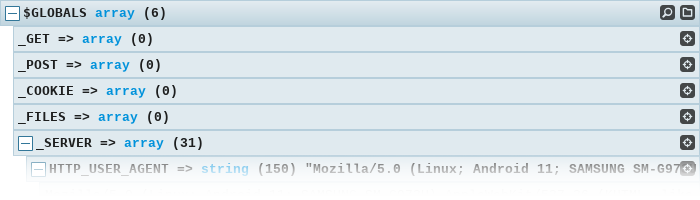
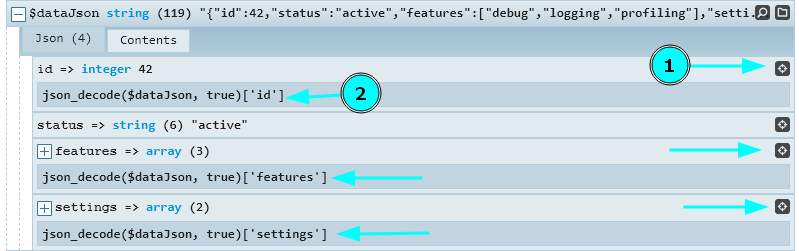
- Live search – This feature let you to fint values through complex data with ease.
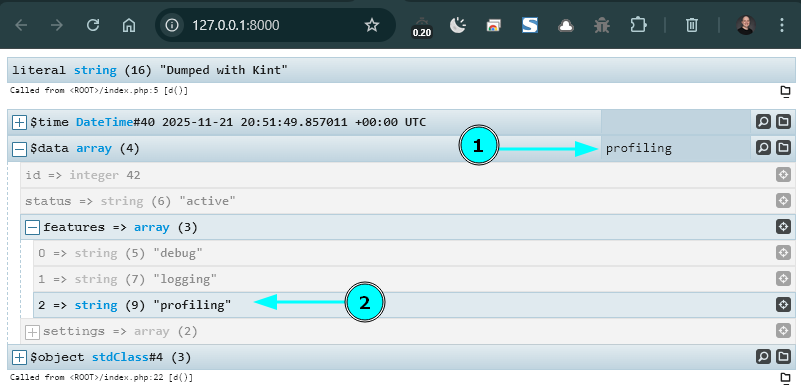
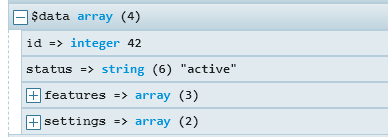
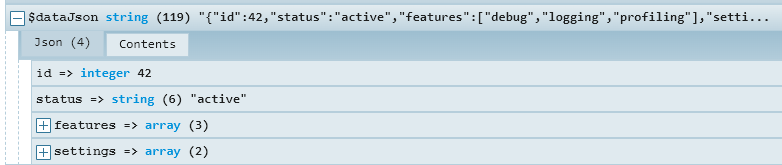
- Dump Data – you can unfold and explore instantly arrays, jsons, php objects, etc.
- Generates code – Kint generates the exact code you need to access specific fields.
Kind have a lot of other nice features, you can see all them here: https://kint-php.github.io/kint/
PHP Debug Bar
🐈⬛ https://github.com/php-debugbar/php-debugbar
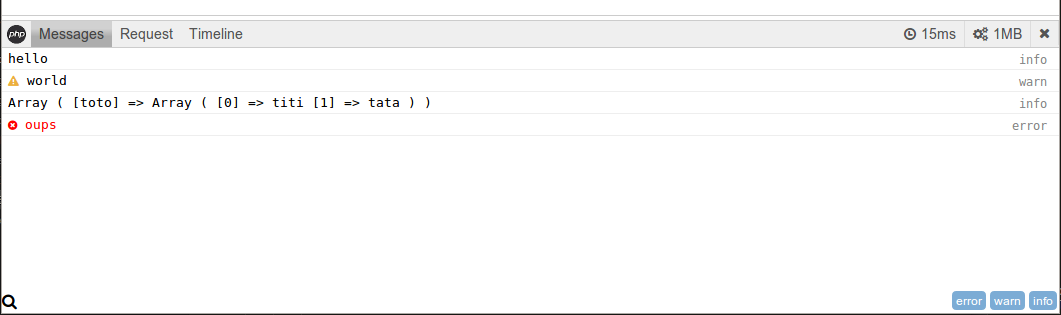
The next tool is the PHP Debug Bar, that displays a debug bar in the browser with information from PHP.
Installation
./composer require --dev php-debugbar/php-debugbarUsage with Composer
<?php
require 'vendor/autoload.php';
use DebugBar\StandardDebugBar;
$time = new DateTime();
$data = [
'id' => 42,
'status' => 'active',
'features' => ['debug', 'logging', 'profiling'],
'settings' => [
'theme' => 'dark',
'notifications' => true
]
];
$dataJson = json_encode($data);
$object = new stdClass();
$object->title = "My Symfony Clone";
$object->author = "Fellipe";
$object->version = 1.0;
$debugbar = new StandardDebugBar();
$debugbarRenderer = $debugbar->getJavascriptRenderer();
// --- MESSAGES ---
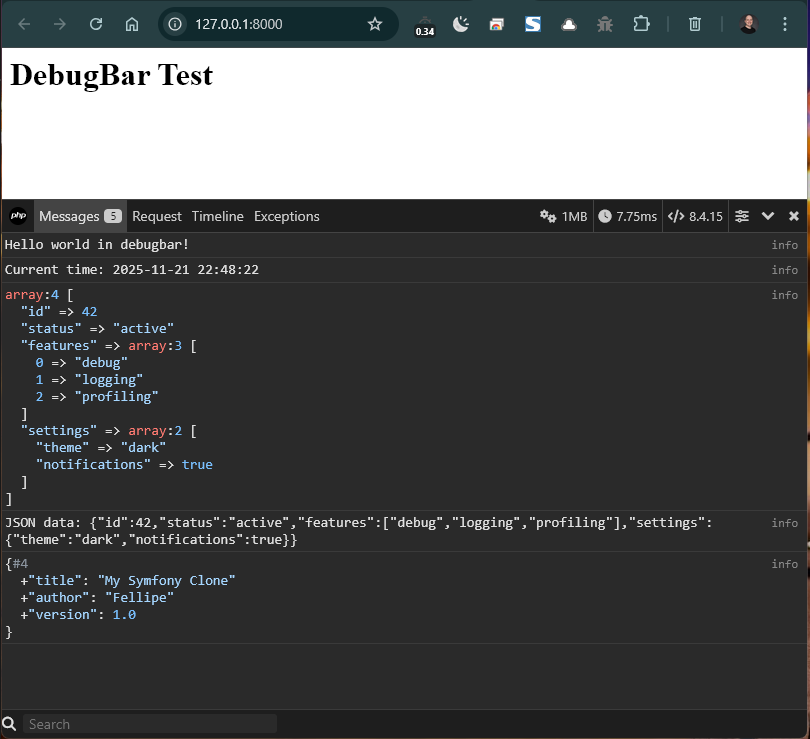
$debugbar["messages"]->addMessage("Hello world in debugbar!");
$debugbar["messages"]->addMessage("Current time: " . $time->format("Y-m-d H:i:s"));
$debugbar["messages"]->addMessage($data);
$debugbar["messages"]->addMessage("JSON data: " . $dataJson);
$debugbar["messages"]->addMessage($object);
$debugbar["time"]->addMeasure("Script started", 0, microtime(true));
?>
<html>
<head>
<?php echo $debugbarRenderer->renderHead(); ?>
</head>
<body>
<h1>DebugBar Test</h1>
<?php echo $debugbarRenderer->render(); ?>
</body>
</html>
Resources
- Search – This feature let you to fint values through complex data with ease.
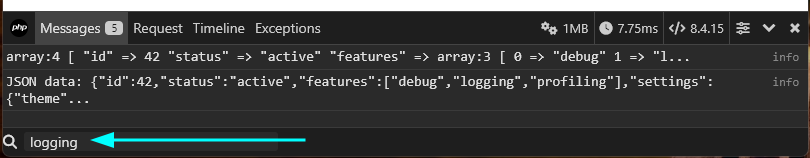
- Dump Data – you can unfold and explore instantly arrays, jsons, php objects, etc.
PHP Debug Bar have a lot of other nice features, you can see all them here: https://php-debugbar.com/
Conclusion
Both are useful tools for debugging. While Kint generates the appropriate code to access data, the PHP Debug Bar seems to make debugging easier with its toolbar.
Keep in mind that both have more advanced features that weren’t covered here.
So, which one do you prefer? Try them out and decide for yourself!
Leave a Reply